
On Thursday, Germany reported 4,000 new coronavirus cases across the country – the highest number since April.
The “worrying jump” means that people in Germany should not let their guard down, said Health Minister Jens Spahn in response to the new figures.
READ ALSO: Coronavirus cases top 4,000 a day for first time since April
We take a look at where in Germany is impacted – from the districts of Berlin to smaller towns which have suddenly become hotspots.
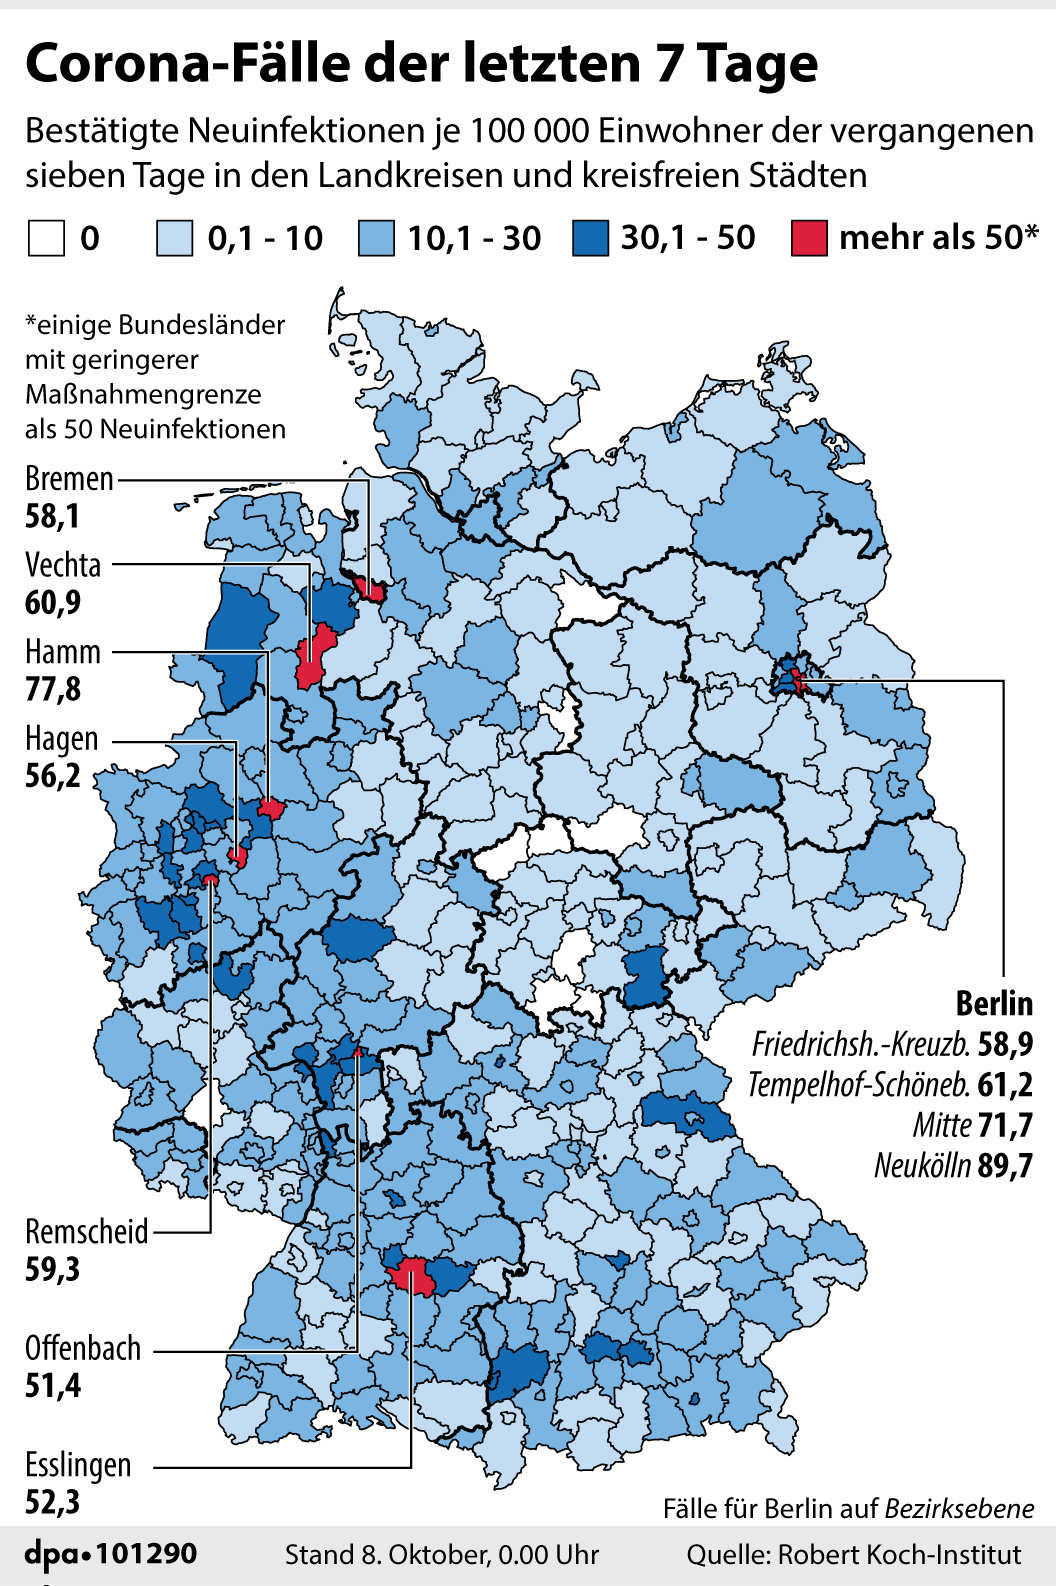
The following map breaks down the number of new infections per 100,000 for inhabitants in the last seven days for various districts around Germany and hotspot Berlin. (Credit: DPA)
The following interactive map breaks down the number of overall cases per German state, the number of cases per 100,000 inhabitants, and the total number of deaths. View larger map. Credit: ESRI
This interactive graph from Germany's Robert Koch Institute (last updated October 8th) breaks down the total number of cases district by district in Germany, including the number per 100,000 inhabitants, and the number of cases over the last seven days. It also gives you the total number of residents to put the figures in perspective.
These were the number of new coronavirus cases which were registered per German state on Wednesday.
4058 #Coronavirus-Fälle in ?? meldet das RKI für gestern. Davon kommen aus:
NRW 1056
Bayern 653
Baden-Württemberg 652
Berlin 378
Hessen 307
Niedersachsen 287
Rheinland-Pfalz 191
Sachsen 118
Bremen 103
Hamburg 93
Brandenburg78Die anderen 5 Länder meldeten <50 Fälle.@welt pic.twitter.com/MQDdKKz9QL
— Olaf Gersemann (@OlafGersemann) October 8, 2020
The city of Hagen, a coronavirus hotspot in Germany's most populous state of North Rhine-Westphalia, created a graph to show the number of new cases per day.
Neue Grafik zur besseren Übersicht: Die blaue Fläche zeigt die Anzahl der aktuell Infizierten. Geheilte, Verstorbene und die Gesamtzahl aller Coronafälle bislang in Hagen sind der Tabelle zu entnehmen. Alle Infos auch auf ➡️ https://t.co/3N4ymFG2xC pic.twitter.com/NeDNGqojCx
— Stadt Hagen (@Hagen_Westfalen) October 8, 2020
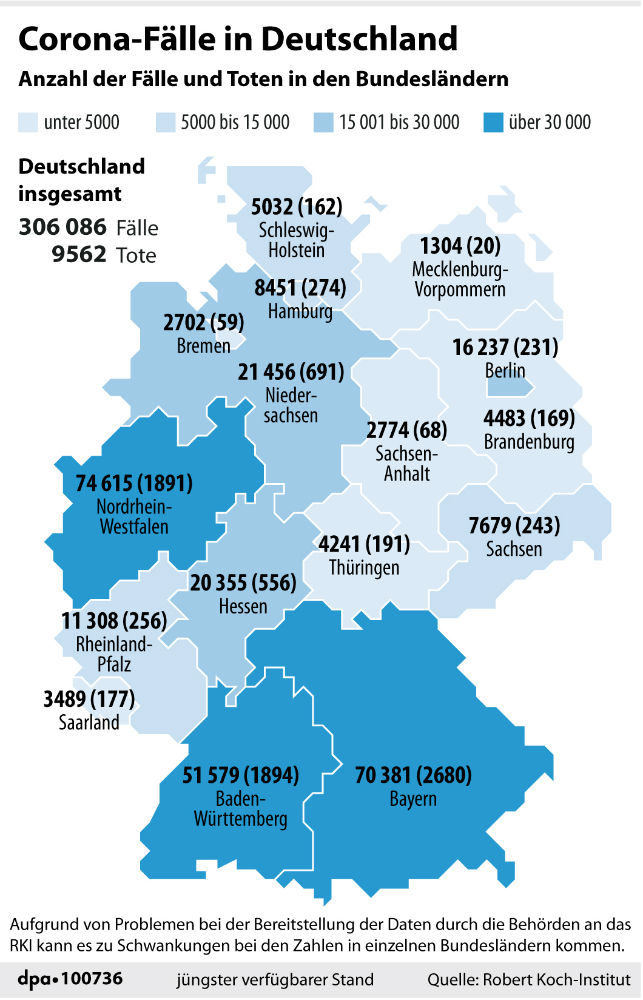
The following map breaks down the total number of coronavirus cases per German state, as well as total number of deaths in parenthesis, since the beginning of the coronavirus crisis. (Credit: DPA)
READ ALSO:
- Coronavirus second wave: Why the party is over in Germany's cities
- One in five Germans plan to 'avoid travel in autumn and winter'
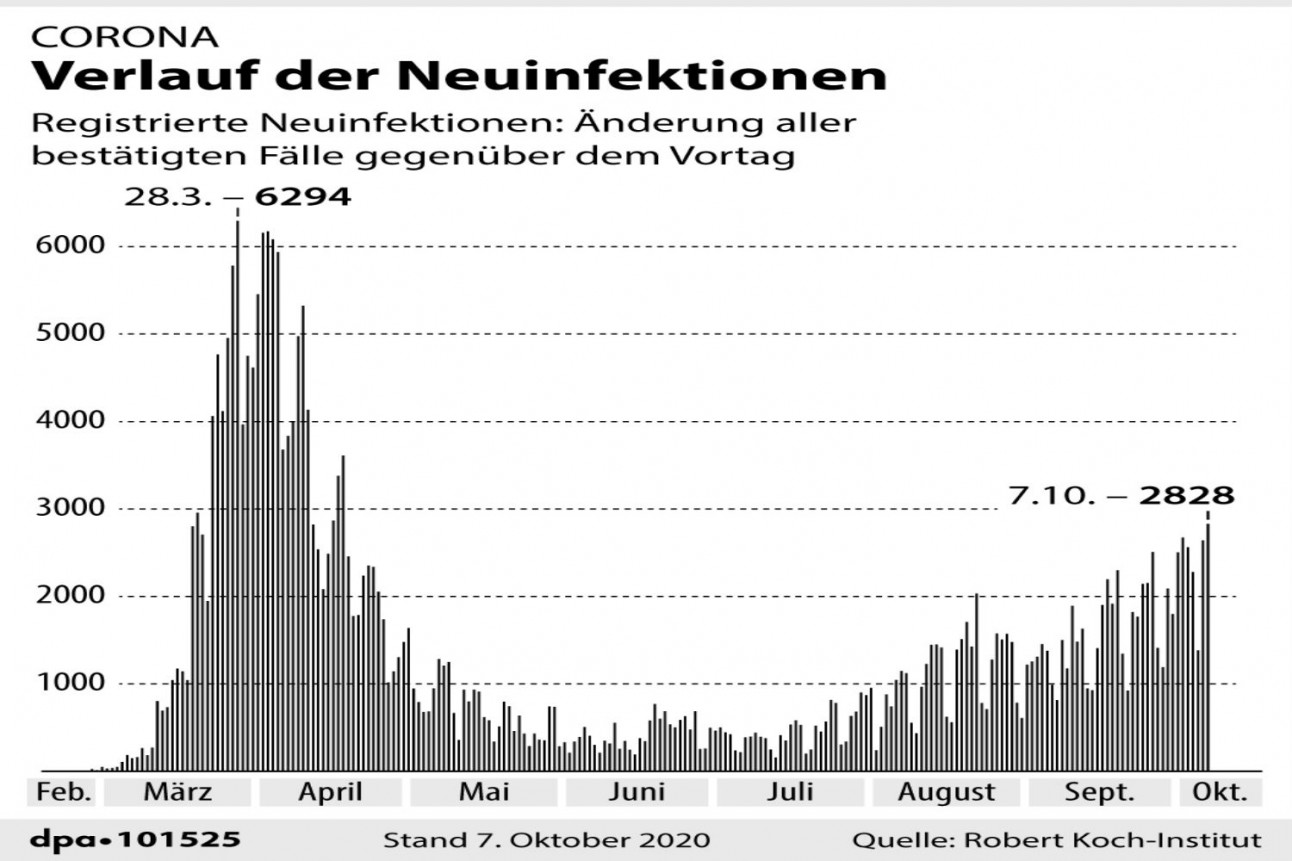
The following map breaks down the total number of new infections across Germany per day since March 28th. (Credit: DPA)

Member comments